Archive for Information design

Upton photos

This slideshow requires JavaScript.

At the moment there doesn’t seem to be a solid identity, The colours dont seem to cross over on to the other bits of info graphics, The fonts aren’t coherent and the signs seems to be almost invisible they have nothing that makes them stand out as much to notice them, There are signs missing I would have no idea what to do if I was there and where and how to get there because the main attractions arn’t labelled and are not made to look like they are a fun attraction how can you plan on bringing in people and revenue when they cant see the reason to be there.

Screen Shot 2013-03-13 at 17.04.43

You can see there are two entrances which lead on to church street and then on to the high street the roads are really simple to see but when you walking around you have no idea how long you will be walking somewhere before you find it and there isn’t a left so you can find the river port/water side.

Semiotics

symbols and icons… Illustrations and wording…

semiotics is the theory of signs it comes from a greek word semeiotics which means interpreter of signs, it meant something on the surface which might sugest something else.

ie. apple means happy but is also could represent health

ie. crown is a crown but it represents royalty

its when something triggers something else in the brain so you can think of something else.

famous semiotics people…

immanuel kant

ferdinanand de saussure

roland barthes

signs mean something other than the immediate image you are looking at.

signifier and signified

adam and eve image –

apple = signifier is used to suggest

temptation (or what is signified)

the person them selfs make up the signified depending on the person and there life experience can change the way they take in the signified in some cases.

how much do you no that your audience knows how will they interpretate this different ages and cultures will see things in different ways.

illustrations are good for displaying concrete ideas.

an image is worth a thousand words.

assessed brief


nuclear road sign..

road signne

here i have changed the colours so they match the highway code colours.

nuclear power station can also be called a power plant so i came up with this idea using the p and doubling it over into a skull.

road sign

I used the original font transport but played with it so make it have the semiotics of a skull.

the acidic green I have used because it makes the mind naturally think of chemicals and gives the impression of danger up ahead, then the red because one it clashes with the green so its very noticeable and the colour red means danger ahead, caution so on so forth by doing this you no straight away that you need to be carful the white outline to the two p’s is just to soften the clash between the two colours because other wise it would be to much for the eyes to take in to play.

here is it when i have put it into a location so you can see what it would look like.

pp

2

warning sign research!!

red signifies warning, this is because doormat in are instincts blood is red so its straight away associated with pain and this means danger.

acidic yellow/green, these colours are the colour of sick which is acidic so naturally the mind associates the colours together, also in the wild the colours tend to be on the markings of animals which are poisonous which normally means there is a chemical with in which is harmful.

skulls are often used as well this genrally just means danger you dont want to look like this be carful ahead.

800px-Vägskylt_vid_vägen_mellan_Stanley_och_Mount_Pleasant

The use of a cross means dont go on something is bad.

white is neutral and easy for the eye to take in.

Signage

everything has been designed from font to image to make it so it easier fro you to get from one place to the other, they do this the same way as a mental map works by using colour and shapes to trigger something in the mind so you can work out what it means like how red means stop and green means go.

animals get from one place to another using natural instinct of navigation, there is a iron oxide in the front of the head which is there so that you can take in magnetic waves and it help you direct your way naturally.

humans have forgotten there natural direction because its all spelt out for them from maps to sat nav.

signs have a lot to do with semiotics which is the science of signs and the way something triggers something in your brain to tell you that its something else.

people have always had lots of different ways to get around from noises like songs or drums the same as birds singing to get the birds to all stay together.

in the past you had drovers which traveled all over the country to get the animals around so people had the meat there were turn roads where there was a toll, the drovers then decide that they would make deals with the farmers to go through there land and it was more direct. they then made natural signage to mark the routes for the drovers.

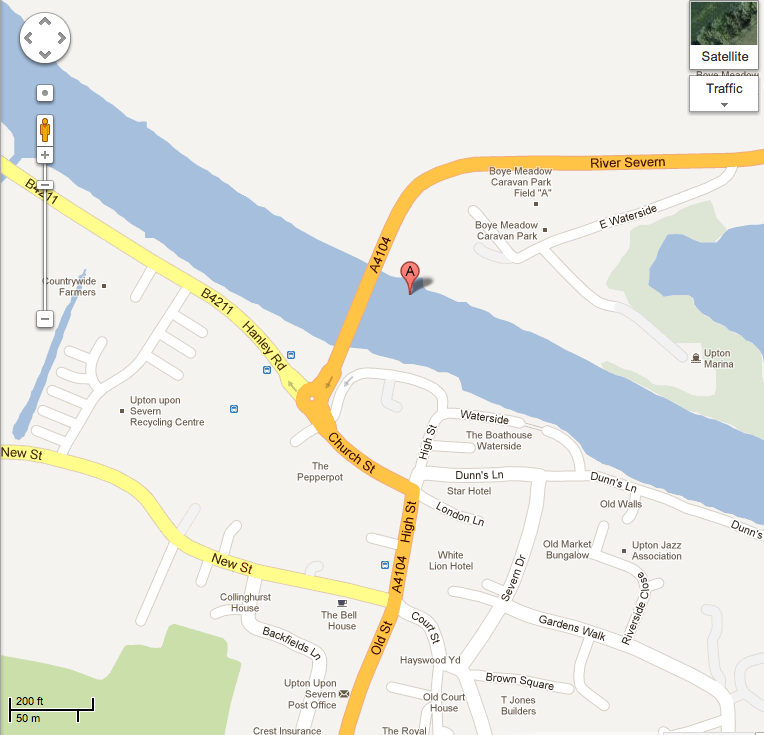
walk out of the main doors walk straight down through the malvern gates then turn left until you see yellow hazard cones turn right once you have gone right follow that road and take the second right follow the road till you get to number eighteen and then your there.

Screen Shot 2013-02-18 at 16.25.13

the map I quickly made to show my walk home luckily I live very closely I have used the colour red to show exits and dashed line to show my walking and black line to show roads and paths and the basic shapes to show my house and the reception.

good information design is invisible you shouldn’t stop and admire it you need to just take in the information not admire over it.

the sign needs to be obvious the majority of the people who are going to use it.

emergency information graphics need to be so simple that you ca understand it while panicing.

mental maps using colour zones such as hospitals using different colours for different zones people can find there way around through remembering the colour.

orientational sign which uses a map as well.

informational signs train stations and so on

directional yellow and black road signs pulls you in.

identification signs certain buildings.

statutory signs rules safety regulations like fire.

ornamental signs, banners flags commemorative plaques.

here are examples of these formats.

41066544

here is an example of oriantional sign you would find this at an amusement park or a zoo or even a collage most places of larger size have this kind of map sign split into basic parts to make it easier for you to get from one place to another.

here is my example of informational signs

1792656-210429-prohibitory-information-signs

information signs are signs where it gets straight to the point with the information that its trying to portray. the shapes are really simplistic but you can tell straight away what it is trying to put across the red means no in most countries and the line makes it so you no this can’t happen.

here is an example of directional signage.

traffic

the yellow on black creates a high contrast which you cant miss to give you this vital piece of information fast also it uses a natural part of your brain as in the natural world things that are black and yellow tend to be poisonous so its a natural signal that this is dangerous.

here is my example of identification signs.

5_EW site identification Chicago sign

identification signage is a sign which labels a place, it tells passer byes who are looking for it that its there it tends to be clean and easy to see.

here is my example of statutory signs.

pcmi-sign4

statutory signs seems to be something that wants you not to do something or gives you emergency information like a fire exit.

here is my example of ornamental signs

t101809_love_lane_rd_02_w407

in a way this could be the same as identification signage as it makes somewhere look more unique and memorable to people but it also seems to be a sign which isn’t so much vital but something that just looks nice.

when you are making a sign you need to make sure its somewhere where lots of people will see it, will the weather destroy it, is the ground level, who are the users of the sign, are there aces issues such as disabilities. the legibility.

typography in signage is very important it needs to be as legible as it can. materials are something that you need to think about.

creating a sign

user testing

installation

watch the top gear clip with Margaret calbet

look on the London design museum

choose a sign, warning tourist or motorway.

plan and sketch, show thought must be 10 by 10 cm photoshop or illustrator to make it… super impose sign where you would like it.

Road signs!!

Jock Kinneir and Margaret Calvert were the creators of the current road signs we see to day, there idea was to make the signs which give us the life or death information at fast speeds we need to no needed to be more readable and be able to be seen from a further distance.

They found that the information they were seeing wasn’t getting across to them well so they created some simple vectors with shapes and numbers and the images became the new road signs for the uk this then spread across the world into other languages and became a universal language of the road which is handy when you have a lots of international people coming in and out of different countries.

dot_image

Biogas!!

Biogas is natural gas which can be used to make energy like electric, heating, fuel, it comes from decomposed waste food peelings, dead plants, and animal manure when it is made into fuel it is called biomethane this happens by removing some of the gasses in the combination, the bio gas combination of gasses is 60% methane and 40% carbon dioxide and other gases intwined in very small numbers…

I am am going to create a diagram of the process between waste and biogass.

Sin título-1

Maps

information graphics have been designed through the ages such as maps in the past maps were bias as they were always drawn up by the concurs which meant that they showed that they would have more things than they truly did you also get maps which show different areas such as different countries or rivers and seas. there are orientering maps which show a direction and a way in which to get from one place to another. you also find contours being used and this shows the hight on the plain of the map, the classic type face of maps is gill sans… a yellow highlight tends to mean a walking route. colours are widely used on maps to show different parts or to key of certain areas. maps were created in the early 1800s and they were scared that the french were going to invade and no one had mapped it so no one new where to place them selfs in order not to get killed by the french it was a military piece of a equipment.there are maps which are not geographical but show other things like Dennis woods electricity maps of street lights.

pumpkins-3dbf3

this map shows were the pumpkins are at halloween also it was found that the more wealthy families were the ones to have them in a way to keep up appearances.

journey strip maps

these were made to show people they were on the right road and it shows whats going to happen in a step by step logic like the tube map. these maps were made by the french when we were under threat of the french. the map starts in aberwristworth and its thought to be a invasion map and to invade from wales rather than to take from the bottom were the innovatory is.

DIAGRAMS

IKEA!!!!

they use lots of clear illustration graphics then the blow up parts of of the image they use small labels in order to meet a piece of information to tell the person what to do with it.

Pioneer 10 probe plaque designed by carl sagon to tell aliens where we are and what we look like. its like a travel guide to get to earth.

the usage of twitter..

twitter100_550-1

this is a fun way to show how many people use the site and in what way they do use it.

rock family trees

60smisc

Information is beautiful

This video, is from a man David McCandless, He worked in media originally magazines and so on then he decided he wanted to move in to a work of Information graphics which he believed were to complicated he decided through making beautiful vectors he could make something interesting which can be understood much more easily and have a more impact of an effect.

He researches intestesting things like what people are most afraid of and when people break up mostly in the year were there are increases and decreases he uses new media like facebook to discover where there is correlation’s and pattens.

He worked on making a interactive diagram called a bubble graph about vitamins and what to eat to be healthy and you can remove parts so that you can see what foods get you what you want maybe you just want to have vitamin c then you can click all the other vitamins off and then you only have to see what you are actually looking for and also by changing size it shows how effective it is so by using colour and size you can give two pieces of basic visual informations from just one shape.

Screen Shot 2013-02-11 at 15.04.30

I think this diagram is one of the most interesting it is built up like a brick wall and by using different sizes you can see an instant comparison, the colour indicates a key which is found at the top ie. lilac means fighting and thats where most the world money is spent which is quite shocking this use of shape makes a really interesting impact piece of information graphics. and then you see that the crisis of the world costs the same amount of every other cost in the world.

Screen Shot 2013-02-11 at 15.15.48

Here is the information graph which I toughed on before of the bubble graph. the different colour binds the different categories apart and also the different size indicates to its importance.

Screen Shot 2013-02-11 at 15.24.36

This graph works well it shows which fish are alright to eat and then there sectioned to where you would find them in the world and what waters. the thing I dont like about this chart it is split in to no maybe and yes to eat but it doesn’t explain whats good about them and why not to eat them so i think it lacks important information.

Next entries »